I kept track on my Bible reading on this blog from 2006 through just a few months ago. I decided I would move that record to another place (Google Docs) for a number of reasons, but a lot of it had to do with finding a way to keep better track and read more. Keeping track has been a huge help in terms of keeping me on track (if you will). The main reason I am made the change is to calculate statistics–that is mostly because I just like to do that–and to up my game a little more. The longer I have kept track the more time I have spent in my Bible. Now I am up to reading at a rate where I make it through the whole Bible with two additional passes through the New Testament each year. Next year, I am going to try to do that plus leave myself some room to do a little more in depth study at the end of the year.
Month: October 2019
Previous: #5 Features for Images in a Folder
Next: Not yet available
This is the sixth in a series of videos I am creating of the research I am performing under the direction of University of Nebraska Lincoln Professor Troy Gilmore to determine whether we can use images taken at the weir on North Platte River at the Nebraska-Wyoming State Line to replicate measurements of discharge and stage by extracting features from the images and using measurements from USGS sensors as ground truth.
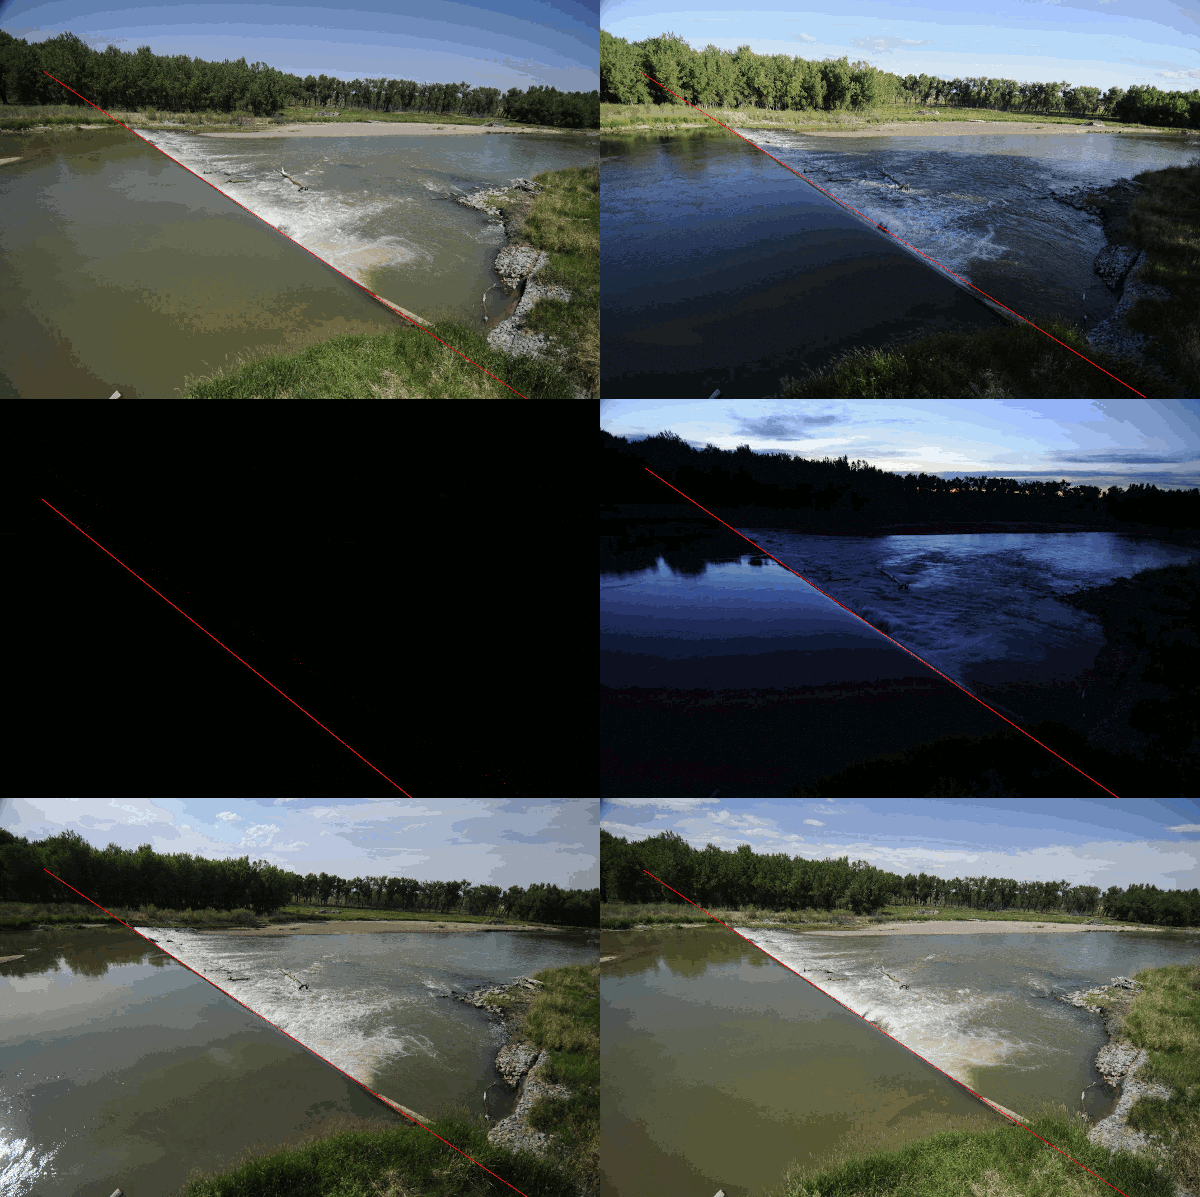
This is the first pass of the weir finder. Notice that it starts missing at night and that it is pretty good, but not perfect. We will refine this.
Previous : #4 Features for Images in a Folder
Next: #6: Finding the Weir
This is the fifth in a series of videos I am creating of the research I am performing under the direction of University of Nebraska Lincoln Professor Troy Gilmore to determine whether we can use images taken at the weir on North Platte River at the Nebraska-Wyoming State Line to replicate measurements of discharge and stage by extracting features from the images and using measurements from USGS sensors as ground truth.
It is necessary to search images with odd (non-rectangular) regions of interest. Eventually, we want to be able to set those regions of interest automatically without manual intervention, but they will help greatly in algorithm development to get started.
Previous: #3 Add a Features Dialog Box
Next: #5 Odd shaped regions of interest
This is the fourth in a series of videos I am creating of the research I am performing under the direction of University of Nebraska Lincoln Professor Troy Gilmore to determine whether we can use images taken at the weir on North Platte River at the Nebraska-Wyoming State Line to replicate measurements of discharge and stage by extracting features from the images and using measurements from USGS sensors as ground truth.
Troy had me add the ability to calculate all the image features for a folder and show them in the GUI. This was a relatively minor change, but it works well. It should be noted that only rudimentary image features are being calculated at this point. We will add more, probably many more, features as we start building classifiers.
Previous: #2 Extracting Metadata from Images
Next: #4 Features for Images in a Folder
This is the third in a series of videos I am creating of the research I am performing under the direction of University of Nebraska Lincoln Professor Troy Gilmore to determine whether we can use images taken at the weir on North Platte River at the Nebraska-Wyoming State Line to replicate measurements of discharge and stage by extracting features from the images and using measurements from USGS sensors as ground truth.
Now that we can look at images, Troy wants a way to start adding features that are calculated from the images. This video is my first pass at adding the functionality we need. It is a dialog box that allows the user to see calculated features for a single image or from a folder of features. It presents the features for a folder of images in comma separated value (CSV) format. That will be used sometime in the future to feed the early machine learning.
Previous: #1 Infrastructure
Next: #3 Add a Features Dialog Box
This is the second in a series of videos I am creating of the research I am performing under the direction of University of Nebraska Lincoln Professor Troy Gilmore to determine whether we can use images taken at the weir on North Platte River at the Nebraska-Wyoming State Line to replicate measurements of discharge and stage by extracting features from the images and using measurements from USGS sensors as ground truth.
Troy’s second task for me was to extract the timestamps and other data from each of the image’s EXIF metadata. That task is now complete and is shown here as an addition to the WaterEval machine learning program for which we laid some groundwork shown in the previous video. We will use this timestamps to select the stage and discharge data from the USGS that applies to each of the images. In addition, we will see whether knowledge of the camera settings changes and can also be added as a feature for our machine learning model.
Next: #2 Extracting Metadata from Images
This is the second in a series of videos I am creating of the research I am performing under the direction of University of Nebraska Lincoln Professor Troy Gilmore to determine whether we can use images taken at the weir on North Platte River at the Nebraska-Wyoming State Line to replicate measurements of discharge and stage by extracting features from the images and using measurements from USGS sensors as ground truth.
My not yet official PhD adviser at University of Nebraska Lincoln is Troy Gilmore. We have been talking via video chat and trading lots of emails in anticipation of getting started after the first of the year. To get a jump on it before I start, Troy has provided me with images of a weir on North Platte River at the Nebraska-Wyoming State Line. He directed me to get started on the infrastructure needed to calculate features from the images that are well suited for use to build a classifier using a Machine Learning model. The first thing he believes we need is a tool to view the images, zoom in and out, load and save images and results, etc. This is the first pass at that. I am sure this application will evolve greatly by the time we are done, but this is our starting place.
Lorena and I enjoyed a quiet evening at home with Kiwi the surviving cat sister on our 27th wedding anniversary. We plan to do something a little more elaborate over the weekend, but it was actually very, very nice just to be together quietly. Lorena made Kung Pao chicken, one of my favorites and we talked about life, were we have been and where we are going.
My desk cycling was going well enough for me that I decided to talk my friend, Stan, into joining me in my efforts to maintain my weight. To that end, I upgraded my DeskCycle to a DeskCycle 2. I think it has pretty much the same hardware as the old cycle, but a little better display and more accurate measurement of calories expended. I like it a lot. I am going to give the original cycle to Stan and we are going to start tracking weight together. Lorena and I have an anniversary today and Stan is taking the Extra Class Amateur Radio license test this week, so we are going to start our joint efforts on Monday.
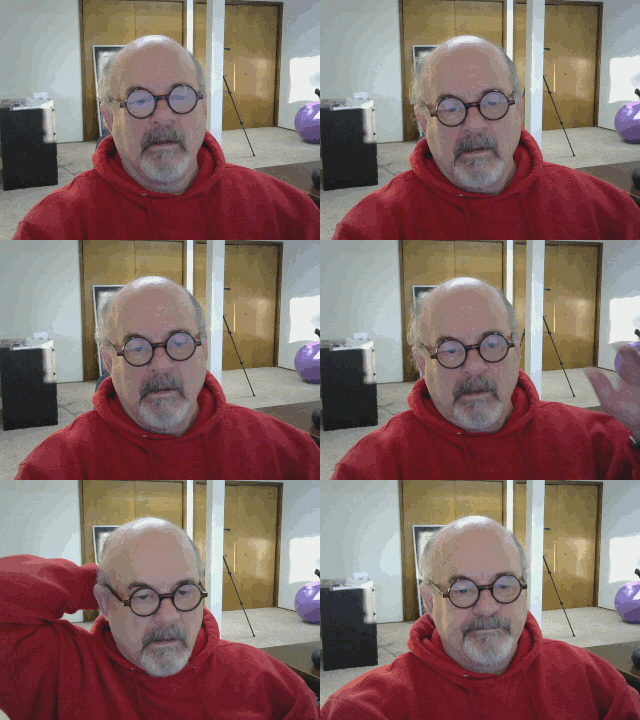
The GIF above demonstrates that I move around quite a bit when I am riding, but surprisingly, I can actually get quite a lot of work done when I am riding. I am doing about a couple of hours per day of light peddling and it certainly does seem to help although eating right seems to help a lot more.
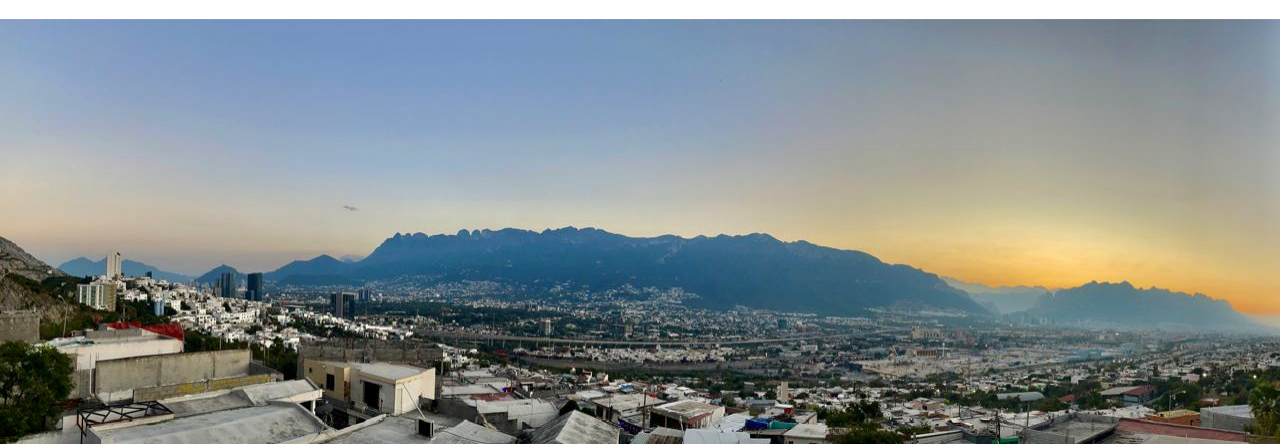
The mountain was beautiful this morning. The layer of crowds below the mountain covers the town and stops just below the top of the ridge where we live. We are kind of amazed that we are still getting new looks/appearances at the same scene after two and a half years of closely watching. We get this kind of scene of the mountain, foothills, and valley every morning when the clouds do not occlude the view. I need to remember to stop working long enough to look out the window at the right time. Maybe I will put a reminder in my calendar to message me.