
My hard work paid off this weekend. I am working with my long-time friend and colleague, Frank, to develop some EKG software for our $27 EKG’s. Actually, the EKG part has gone up now to $51 and the Arduino needed to run it costs another $20. At any rate, the software shown here accommodates six channels (even though that has not yet been tested because I only have one channel). It needs some cleanup, but it works great.
Tag: EKG
When I started building my $27 EKG, I just assumed there would be an excellent library to chart the output to the screen in a compelling and useful way. There are a couple of libraries that are pretty good, but they are either really old, have bad open source licenses, are not fast enough (we need to eat a lot of data in real time) or they do not do exactly what we want. It is a little bit of a hassle to write something like this when in a rush, but it could not be helped. That is what I did most of the day yesterday. I hope to have the thing all up and running in the next few days. It will be useful to have an unencumbered library for a lot of the things we want to do with this little project and probably for future projects, too, so it is not a loss.
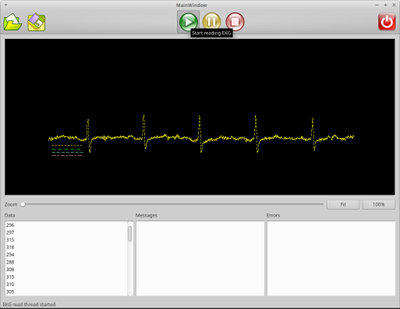 I had a little bit of a breakthrough on my EKG project last night. I actually had the idea when I was completely away from the project for a few days. It caused me to re-read the manual where it said the readings from the EKG are sent down the serial cable in big endian order. Each value for a 10-bit number takes up two bytes. The high order byte can either be first or last. The receiving computer expected little endian order. I now swap the bytes before they are plotted or recorded and we get the beautiful plot above. You can barely see four little lines below the left side of the signal plot. Those lines make up the legend for the electrode channels. The system can handle six channels, but we are going to try to do just four on this setup. The next step is to get the graph to be a moving strip chart. The graph, as it is right now, just writes over itself.
I completely duplicated my current setup for a friend, Frank who is joining this project. He is way more skilled than I in a lot of this stuff–especially the electrical engineering parts. I need to order myself an additional three channels of electronics, but that is on its way to Frank right now.
P.S. We are thinking of cross platforming (Windows/Linux) and open sourcing (free as in both freedom and beer) the software and writing a user guide/tutorial on how to set the thing up if anyone shows any interests because there does not seem to be anything out there that is really hobby friendly. If I am wrong, maybe someone can correct me. Because of our day jobs we are still months away from that.
 One of the most painful aspects of the work I do is that I need to learn to work with new software libraries on a regular basis. The pain is associated with learning new syntax, parameters, and usages. One generally knows what the libraries are supposed to do, but cannot get them to work until all of the nuances, idiosyncrasies and minutiae are well understood. For extensive libraries, that just takes a lot of time–at least for me. There are some libraries I have used for so long (OpenCV, Boost, Qt, etc.) that I can rapidly do the vast bulk of what needs to be done in a new application because I am intimate with the minutiae. But there is always something that changes and requires the use of new libraries–obsolescence, license changes, functionality changes and that sort of thing that require the adoption of new libraries. I actually kind of enjoy learning new stuff, but it is a lot more fun when there is no schedule or budget to create stress.
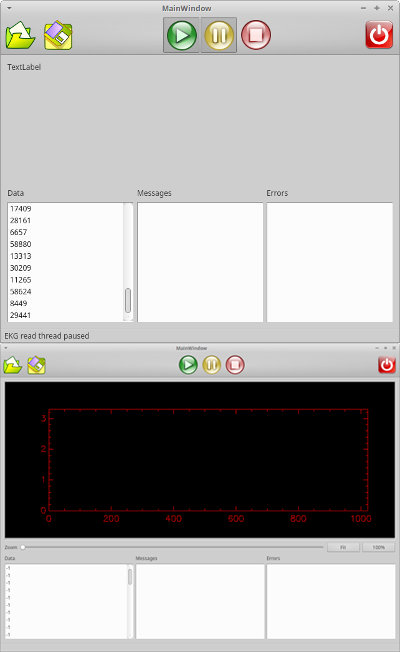
What was that all about? I have found some libraries I want to use to plot my EKG. They look great and I wish I would have started working with them sooner. I am confident now (well, not 100%, but very confident) they will be an excellent fit for this and future projects so I am starting to use them. Last night I spend three hours to get from the top images to the bottom image, then discovered I was probably using the wrong chart type for the thing I wanted to do, so I spent another hour to start getting the new graph type in place, but never got it quite working. This kind of thing is normal for me. Maybe I am just slow, but perseverance counts both in software development and in learning. Maybe I will be able to get the chart going tonight.
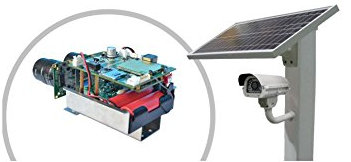 I have had little time to work on the GaugeCam project due to other responsibilities. We got a helping hand with this product when we found that there are now cameras available that do precisely the part of the product we did not want to do and at which we were not that good. The camera in this post is an example of that. Before, we had to put together a cellphone enabled remote camera with mounting systems, batteries, a solar setup, etc. Now, you can just buy it and install it yourself. So now I think we will be able to concentrate on the software and the water level data that is accumulated from the product which is really our strong point anyway.
Now I will be able to concentrate on my EKG project a little more before I go back to GaugeCam. Also, I will be able to use the BeagleBone Black I purchased on the EKG if I want. I am hoping to communicate between the Arduino/EKG electronics and the mothership computer via Bluetooth, but I am not sure I can get it to go fast enough. The Bluetooth will handle it, but I do not know if the Arduino can shovel the bits fast enough for the EKG sample rate I need (1K Hz). We shall see!