
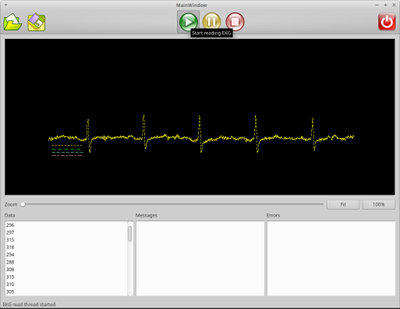
 I had a little bit of a breakthrough on my EKG project last night. I actually had the idea when I was completely away from the project for a few days. It caused me to re-read the manual where it said the readings from the EKG are sent down the serial cable in big endian order. Each value for a 10-bit number takes up two bytes. The high order byte can either be first or last. The receiving computer expected little endian order. I now swap the bytes before they are plotted or recorded and we get the beautiful plot above. You can barely see four little lines below the left side of the signal plot. Those lines make up the legend for the electrode channels. The system can handle six channels, but we are going to try to do just four on this setup. The next step is to get the graph to be a moving strip chart. The graph, as it is right now, just writes over itself.
I completely duplicated my current setup for a friend, Frank who is joining this project. He is way more skilled than I in a lot of this stuff–especially the electrical engineering parts. I need to order myself an additional three channels of electronics, but that is on its way to Frank right now.
P.S. We are thinking of cross platforming (Windows/Linux) and open sourcing (free as in both freedom and beer) the software and writing a user guide/tutorial on how to set the thing up if anyone shows any interests because there does not seem to be anything out there that is really hobby friendly. If I am wrong, maybe someone can correct me. Because of our day jobs we are still months away from that.
Leave a Reply