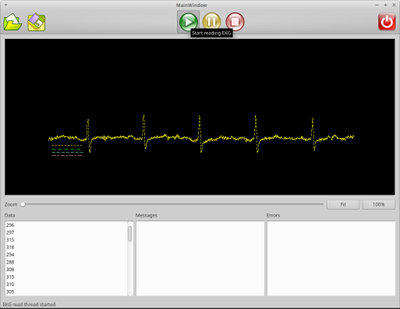
 I had a little bit of a breakthrough on my EKG project last night. I actually had the idea when I was completely away from the project for a few days. It caused me to re-read the manual where it said the readings from the EKG are sent down the serial cable in big endian order. Each value for a 10-bit number takes up two bytes. The high order byte can either be first or last. The receiving computer expected little endian order. I now swap the bytes before they are plotted or recorded and we get the beautiful plot above. You can barely see four little lines below the left side of the signal plot. Those lines make up the legend for the electrode channels. The system can handle six channels, but we are going to try to do just four on this setup. The next step is to get the graph to be a moving strip chart. The graph, as it is right now, just writes over itself.
I completely duplicated my current setup for a friend, Frank who is joining this project. He is way more skilled than I in a lot of this stuff–especially the electrical engineering parts. I need to order myself an additional three channels of electronics, but that is on its way to Frank right now.
P.S. We are thinking of cross platforming (Windows/Linux) and open sourcing (free as in both freedom and beer) the software and writing a user guide/tutorial on how to set the thing up if anyone shows any interests because there does not seem to be anything out there that is really hobby friendly. If I am wrong, maybe someone can correct me. Because of our day jobs we are still months away from that.

 Christian was a pretty good cook by the time he left home for college. He could more than hold his own when it came to the basics and had a few specialties he liked to do. Kelly had an even wider repertoire and loved to experiment with her mom whenever she got the chance. I am not sure what I expected when they went off to college. I did not really think about it much, but I have to admit I am a little surprised at how much they have both embraced the art of cooking.
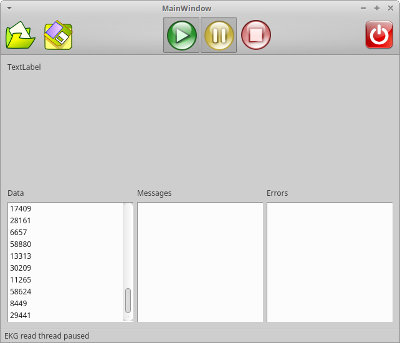
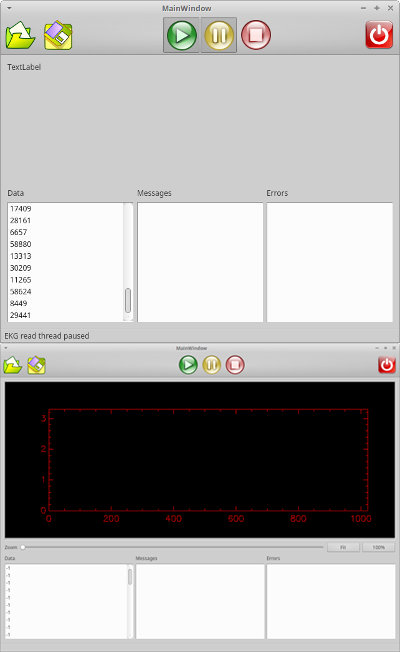 One of the most painful aspects of the work I do is that I need to learn to work with new software libraries on a regular basis. The pain is associated with learning new syntax, parameters, and usages. One generally knows what the libraries are supposed to do, but cannot get them to work until all of the nuances, idiosyncrasies and minutiae are well understood. For extensive libraries, that just takes a lot of time–at least for me. There are some libraries I have used for so long (OpenCV, Boost, Qt, etc.) that I can rapidly do the vast bulk of what needs to be done in a new application because I am intimate with the minutiae. But there is always something that changes and requires the use of new libraries–obsolescence, license changes, functionality changes and that sort of thing that require the adoption of new libraries. I actually kind of enjoy learning new stuff, but it is a lot more fun when there is no schedule or budget to create stress.
 I have had little time to work on the
  Yesterday was a long day with some accomplishments. First, and maybe most important, Kiwi did not die while we were gone. Lorena’s cousin Beto was there to look in on here every now and then, but for the most part, she was on her own. She was and continues to be annoyingly happy to see us.

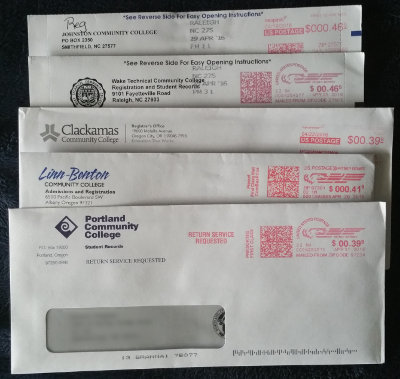 These are all the transcripts from the community colleges Lorena has attended since we got married. Actually, she took classes at a community college in Florida, too, but that was just for non-credit English as a second language classes. She is very close to her degree, so she plans to try to get it done here in Texas. The five sealed envelopes from five different places represent a lot of work. I congratulate her for her continued effort. She will take these to North Central Texas College on Monday to get the process started here. We think she only has four or five classes left for an Associates degree. Stay tuned.