"In the world ye shall have tribulation: but be of good cheer; I have overcome the world." –John 16:33

San Pedro Garza Garcia

Tag: statistics Page 1 of 2

Statistics is queen

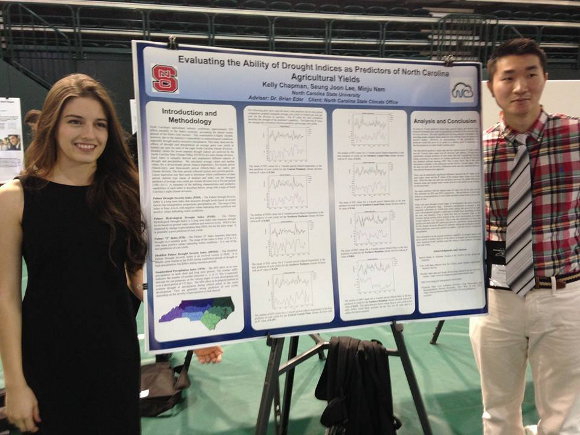
Our friend Francois, a professor at NCSU told us that if Kelly got a degree in Statistics then went on to something in the Humanities or Business, she would be the “queen of the department” wherever she went. We thought that was pretty cool at the time, but had not thought about it much since then. Kelly got accepted into a great PhD program and then struggled. On average, everyone else in the program was eight years older than her, the youngest being three years older than her when they started. Almost all of them had an MBA and three to five years of experience before they entered the PhD program. There were a couple who went straight from their undergraduate degree to the PhD program, but had a fairly extensive undergraduate research experience. Kelly, on the other hand, was literally, just two years out of high school, or at least that was how old she was when she started.

She has struggled because she was in the habit of taking hard classes that would help her in her understanding of Statistics and not the general Business leveling classes. She has done great in her TA’ing duties and her classes. She knew (knows) how to deal with hard technical material and with people. She started slowly on her RA’ing tasks, but know that she knows what is expected, she excels. The challenge was the research. She had no background at all in formal, technical research. She has struggled. She has her first formal, publication quality paper due in the second week of February. Her work habits were really pretty good by the end of her undergraduate degree at NCSU, but no where near the level she needed to operate at the PhD level. She has hammered away at it though, and today she is performing at a higher level than she ever might have thought she was capable.

So the payback is that her roommate who is in precisely the same program as Kelly, but seven years older with a PhD professor (Dean, actually) father, is coming to Kelly for help on the truly hard stuff. It is a sweet thing, when you have done the truly hard stuff, to enjoy the benefits and security of having it behind you. Congratulations to Kelly. You can not beat a hard STEM degree, no matter what you go on to do after.

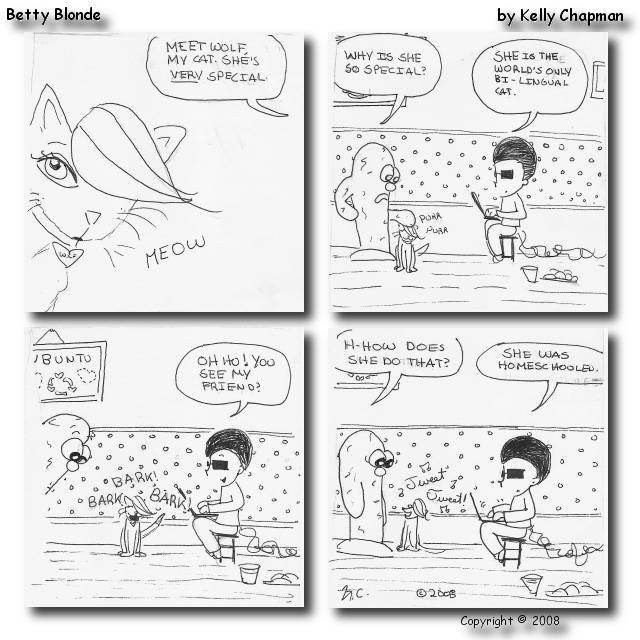
Betty Blonde #470 – 04/29/2010
Betty Blonde #470
Click here or on the image to see full size strip.

The Reproducibility Project: Psychology

There is a great article in the Weekly Standard titled Making It All Up, the Behavioral Sciences Scandal about how over 60 percent of published results in the field of Psychology are not reproducible. Here and here are articles from the journal Nature on the same subject along with another one from the journal Science. I sent my daughter, Kelly a link to the articles. She is working on a PhD in Marketing at University of Washington and takes research methodology classes from both the Sociology department and the Psychology department. Replicability is a big topic in those classes. Kelly made the argument that research done in marketing does not suffer from the same problem as in the social sciences or even the hard sciences because the measure of the quality of the research is whether more stuff gets sold. That is the point–selling stuff. So if the research does not lead to new insights into how to sell stuff, the funding dies. I think I might buy that idea. But then again, it was a Marketing researcher who told me that.

Betty Blonde #412 – 02/12/2010
Betty Blonde #412
Click here or on the image to see full size strip.

Intelligent design in real life

$5 of coffee for free!
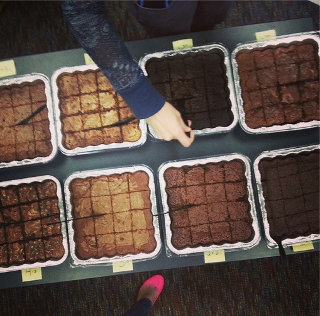
An amazing thing happened yesterday. One of the managers at my work won a $5 Starbucks gift certificate for getting a correct answer on a safety question. In a classy move, he did a “guess the number” raffle with his team. About seven people participated. The number was 43. Two of the guessers got it right. We were pretty sure no one cheated. I was one of the guessers how picked 43. I picked it because 42 is the answer in Hitchhiker’s Guide to the Galaxy and I hate that pretentious, badly written tome so I one upped it to 43. What are the odds? My immediate thought is that my picking 43 was definitely not random. Actually, whether the reason for picking 43 was overt or subliminal, I am pretty confident the other two who picked it (the raffle organizer and the other guesser) did not pick it randomly either. But then what could be the cause?
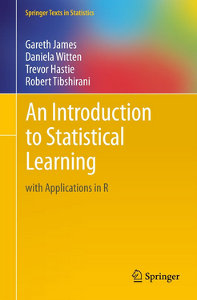
Betty Blonde #393 – 01/18/2010
Betty Blonde #393
Click here or on the image to see full size strip.

A tutorial on machine learning

I just found a book, available free online, about machine learning. It has a lot of great recommendations and is in an area where I have yet to advance my skills beyond a beginner level. It is a book Kelly might be able to use if she is not already too advanced. I thought I would start to try to work my way through it. It might finally get me kick-started in this area.

Betty Blonde #296 – 09/04/2009
Betty Blonde #296
Click 
here or on the image to see full size strip.

NCSU and UTEP weigh in on fast food workers and the minimum wage

Day 865 of 1000
Betty Blonde #31 – 08/28/2008
Betty Blonde #31
Click here or on the image to see full size strip.

Carl Bialik, the Numbers Guy over at the Wall Street Journal has an insightful article on a study about fast food workers and how their low wages impact our taxes. Not surprisingly, the liberal authors of the study from Cal Berkeley and U. Illinois, interpret the data to say that low wages workers cost the taxpayers $7 billion dollars per year in benefits from four major nationwide government programs.  A professor from my Alma Mater points out the obvious:

Thomas Fullerton, an economist at the University of Texas at El Paso, said his “interpretation of this evidence differs from that of the authors.” Fullerton added, “In the absence of jobs in the food service sector, the fiscal burden represented by these workers would be much worse simply because their income levels would be even lower and they would require greater amounts of public assistance in order for their families to survive.”

A professor from NCSU (Kelly’s and Christian’s school) makes the same point.  It is amazing how often academics with an agenda generate some data, then make totally unsupportable conclusions about what the data says.  In this case, it seems very unreasonable to conclude that taking away low wages jobs by raising the minimum wage will somehow cost the taxpayers less.

Big Data, Quantum Computing breakthrough

Day 843 of 1000
Betty Blonde #22 – 08/15/2008
Betty Blonde #22
Click here or on the image to see full size strip.

IBM made a big breakthrough that could have a big impact on the cost and performance of “Big Data” systems.  The breakthrough has to do with something called Quantum Computing that allows for much faster processing than with certain classes of problems.  Big Data is an area where Kelly and Christian will probably both work.  The breakthrough is the ability to demonstrate Bose-Einstein Condensation at room temperature.  I am sure we are quite a ways from use of the techonology in the wild, but it will make Statisticians with Big Data skills more employable before too long.

A Masters Degree in Statistics in parallel with a PhD in something else

Day 837 of 1000
Betty Blonde #19 – 08/12/2008
Betty Blonde #19
Click here or on the image to see full size strip.

Kelly and I have been talking about what she should do next.  She loves Statistics.  We are all, she included, are amazed at her passion for her degree.  She knows she wants to use Statistics in her work.  She also knows there is a very important distinction between the use of Statistics and the study and research of Statistics.  She wants to do the former, not the latter.  Still she believes she would like to increase her Statistics toolset.  She also believes she would like to get some specific domain knowledge in a field where Statistics is highly valued.  Marketing appears to really fit the bill.  It is very interesting and Statistical tools are critical in Marketing.

The problem is that these seem to be competing goals.  Does she want to improve her toolset with a Masters Degree in Statistics or go straight to the domain knowledge with a PhD in Marketing.  It turns out that it is possible to do both at the same time without staying in college any longer.  We found the following little gem at the bottom of this page on the UC Irvine website:

Students who are currently enrolled in a doctoral program at UCI and wish to pursue a Master of Science degree in Statistics at the same time should consult with the Director of Graduate Studies in Statistics to register their interest with the Department, to develop a program of study, and to establish a relationship with a faculty advisor in Statistics.

We were ecstatic.  This is exactly what Kelly wants.  It is pretty hard to get into a good PhD Marketing program without 5-10 years experience, exceptional GRE scores and a Masters Degree, but they let a few, very qualified students with only a Bachelors Degree into some programs.  She is resigned to the idea that she might have to go to work for a few years, but we are keeping our fingers crossed for this year.

That was such a cool thing, we decided we should check into the same thing for Christian.  If we find something, we will post it her.

Thanksgiving and frequentists vs. bayesians

Day 829 of 1000
Betty Blonde #13 – 08/04/2008
Betty Blonde #13
Click here or on the image to see full size strip.

Everyone one is still in bed at 9:30 on Thanksgiving morning.  Christian stayed up later than everyone to work on his Linear Algebra take-home exam.  I stayed up late to give him some moral support.  Lorena and Kelly stayed up to watch some wedding video of some of their friends.  I woke up this morning at about 7:30 to the cat staring me in the face and yowling like crazy.  So I got up to feed her, check the turkey (it has to be close to room temperature before I start cooking it–we are ready to go), have a cup of coffee, and do my morning reading.

There is a fascinating philosophical cat fight between Frequentists and Bayesians going on in the world of Statistics.  A blog articles titled Statistical Zealots over at Simply Statistics is about that fight. Be sure to read through the comments.  Some of these people are serious as a heart attack about this issue. Kelly and Christian have been telling me about and I meant to read up on it to figure out what it is about. I consume statistical consulting services in my work, so I am sure I will run into this in the future and it will be important to understand the issues.  It might take some real work to understand all the issues.  Fun stuff.

Another monster topic of great importance today is that my wife and daughter made a lemon merangue pie for us last night.  My Finnish grandmother, Ida Jenkins, always made lemon merangue pie, from scratch, at Thanksgiving when I was growing up.  It was very tart with a TON of merangue.  We plan to make this an annual tradition.  This is the first year, so the girls just followed the recipe.  It looks awesome.  Next year, I am going to lobby to up the tartness and up the merangue.

UpdateHere is a blog post with amazingly helpful description of the philosophical issues behind the Bayesian vs Frequentist cat fight.  It helped me a lot in my understanding, has some reference links, and even a pointer to “the ugliest blog in the world” which is about Statistics!

Kelly’s undergraduate research symposium at UNC Charlotte

Day 817 of 1000
Betty Blonde #2
Betty Blonde #2
Click here to see full size strip.

Lorena drove Kelly to UNC Charlotte for an undergraduate research symposium this morning.  Several teams from NCSU went there yesterday.  Kelly stayed behind to print out all the posters for the three Statistics teams, so she was kind of the hero when she got there this morning.  Here she is with one of her teammates by their poster.

Kelly at the undergraduate research symposium

The BEST statistics class

Day 814 of 1000

Quality control browniesMy professor for Statistical Quality Control at the University of Texas at El Paso was Dr. Thomas McLean. He was the head of the department, a classmate of Ross Perot at the Naval Academy, and a great guy. I was there to run the Machine Vision Applications Laboratory which was started by Dr. Carroll Johnson and I, but they talked me into getting a Masters degree in Industrial Engineering at the same time.  I had to take a few undergraduate leveling classes to get started and the SQC class was one of them.

I loved the class.  It was not so much that the material was so complex or innovative, but that I had worked in the manufacturing sector for ten years before I arrived at UTEP and I understood its importance.  SQC is a tool that is frequently used in conjunction with Machine Vision.  Machine Vision has been the main focus of my career, so it was great to take that class with an excellent instructor.  I used what I learned in that class for part of my thesis and frequently ever since.

I told Kelly about the class.  I am sure she was a little skeptical, but she was required to take it as part of her Statistics degree.  She has enjoyed it a lot.  Yesterday, she had to make brownies that were used as part of a project for the class where the quality of a process was measured and evaluated.  What an awesome way to make this material come to life.

Corn yields in North Carolina: an exciting new statistics paper

Day 791 of 1000

The following is the abstract for Kelly’s undergraduate research work.  It is very cool that I am actually excited about this!

Evaluating the Ability of Drought Indices as Predictors of North Carolina Corn Yields

Corn is of growing importance to North Carolina’s agricultural economy.  The ability to accurately predict corn yields per year under different different climate conditions is essential.    The North Carolina State Climate Office (NCSCO) maintains seven separate drought indices that contain information on precipitation dating back to 1895 for each of the eight North Carolina climate divisions. Drought index data used spans the period from March through October for each year from 1981 to 2011, reflecting the normal growing season of corn in North Carolina.  This study first attempts to determine if there is a correlation between drought and North Carolina corn yields over time, using North Carolina corn yield data from the USDA. The study will then attempt to determine which of the indices are the best predictors of corn yield per year for each climate division in the case of a correlation. If any strong corn yield predictors are found, expanding the drought indices’ predictive capabilities to other important North Carolina crop yields, such as tobacco or soybeans, could prove to be useful.

The only thing that might be cooler is if she were doing statistics on pork bellies.  After all, this is North Carolina.

There is something wrong with this picture

Day 775 of 1000

Kelly works the two big monitors on her stats project at Hunt Library NCSU
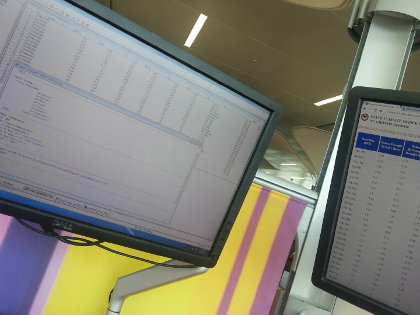
This a picture Kelly snapped while at work at the fabulous new NCSU Hunt Library today. As I am stuck out in Prescott without the family working through the weekend, I got a little melancholy.  Lorena, the kids and I started going down to the NCSU Hill Library (the old one) when the kids started community college three and a half years.  At first it was fun because we got to watch the posturing and histrionics of the college kids while Lorena, Kelly, and Christian studied and I worked on volunteer research for NCSU. 

When the kids moved on from community college to NCSU, we continued to go about every other Saturday, but now it was even more fun because the kids were part of the drama.  Then, at the beginning of 2013 the best college library in the world opened over on the Centenniel campus.  Now, we only have a few short months to go to the library together.  I want to enjoy every chance I get to be with the kids before they go off to graduate school in the west.  Fortunately, the plan is for me to be home for a couple of weeks after this trip and I plan to make the most of it.  I am very thankful that they still do not mind if I tag along. 

Religious wars in the world of Statistics

Day 772 of 1000

I logged for one summer in North Idaho while I was in college.  Though I had worked in sawmills a lot, I found the logging culture both different and interesting.  There seemed to be a constant flame war going on about which cork boots were best (White is the brand I remember).  There were also continuous arguments about chainsaws (Stihl, Husqvarna, etc.), the “right” way to file you saw chain (whether to do it yourself or have someone else do it), and a million other work and tool related subjects.  It is really not much different in the world of of programming.  There is always a struggle to get everyone on the same page with respect to programming languages, development environments, debuggers, hardware, etc., etc.

I got a kick out of the seventh item on this list in an article at Simply Statistics.  It points to an article about using something called Hadoop to deal with “big data” problems.  I am just starting to learn more about different statistical tools, so it was great to be able to glean information about tools that are new to me from this article like pandas and scalding.  The pop-culture element of the article is the reason I thought to right about it here.  The disdain with which the author writes about Hadoop is more than matched in the comments section below the post.  I especially like an aside written by one of the commenters in response to a commenter before him who extolled the virtues of  language named Erlang while hammering everything else:

[Edit: I have had a poke around, and you appear to have a bit of a history of trolling and flaming-anything-that-isn’t Erlang, so if you don’t mind, I will take your criticism with a grain of salt.]

Christian and I discuss this kind of thing pretty regularly.  It is hard not to get caught up in the religious wars.  It is something I have to fight on a regular basis.  In industry it is critical to do what is best for the company.  Sometimes that means reuse of a really, really bad code base to get something to market quickly.  Sometimes it means using almost dead cult languages like Delphi and Haskell (see, I still have some religion) that have little penetration in the real world.  As I get older I realize there is nothing new under the sun.  Before there were chain-saw arguments, I am sure there were axe arguments.

Swirl: An interactive learning environment for R

Day 770 of 1000

There is a post over at the Simply Statistics blog that talks about an interactive programming environment for the R statistical programming language called swirl.  I have decided to download this when I am back in my Hotel room tonight (I am working in Prescott, AZ this week) and report what I find.  It is amazing how important statistics has become in the work I do in machine vision.  The last four jobs (including this one) is loaded with it.  I just sent a set of data off to members of our team in Australia and China because we do not have anyone here yet who can handle it.  I suspect, I will be hiring a data science consultant to pick up some small projects, soon, but believe we will be hiring a fulltime data scientist within two or three years just to consume the data we produce in my group.  I need to start studying R and Weka to get enough knowledge to hire well.  I would like to learn SAS and JMP, too.  Kelly says JMP is not so expensive, so we might start with that.  Fortunately, I have some data scientist friends who are capable of helping me.

Statistics Unconference

This is something for Kelly.  Is this cool or what.  A live stream, Statistics Unconference with excellent presenters from JHU, University of Washington, and R-Studio.  It is about the future of Statistics and statistical tools.

Baltimore

Day 757 of 1000

Ever since Kelly went to live in Baltimore for a summer data scientist internship at the Johns Hopkins University Applied Physics Laboratory, she has been a HUGE fan of Baltimore.  Her summer with Bryan and Celia could well have been her best summer ever.  Kelly, as everyone knows, is also a huge fan of all things statistical.  She has gotten me so interested in the subject that I have taken to reading Statistics blogs.  My favorite is The Numbers Guy Blog at the Wall street journal, but I just ran into another one that looks great.  The name of the blog is Simply Statistics and the first post I read there is about an online course I should take on Data Analysis.  The second article, written by the Director of Graduate Studies from the Department of Biostatistics at JHU, is a hagiography about Baltimore titled So you’re moving to Baltimore.  Kelly should love it.

NCSU wins a huge analytics grant

Day 724 of 1000

This morning when I read the news on Free Republic, I ran into this article on a new program at NCSU.  That pointed to this article in the News and Observer that describes the new “Big Data” joint venture between NCSU and the NSA.  It starts out like this:

As the field of “big data” continues to grow in importance, N.C. State University has landed a big coup – a major lab for the study of data analysis, funded by the National Security Agency.

A $60.75 million grant from the NSA is the largest research grant in NCSU’s history – three times bigger than any previous award.

The Laboratory for Analytic Sciences will be launched in a Centennial Campus building that will be renovated with money from the federal agency, but details about the facility are top secret. Those who work in the lab will be required to have security clearance from the U.S. government.

NCSU officials say the endeavor is expected to bring 100 new jobs to the Triangle during the next several years. The university, already a leader in data science, won the NSA contract through a competitive process.

NCSU university already has strengths in computer science, applied mathematics and statistics and a collaborative project with the NSA on cybersecurity. The university also is in the process of hiring four faculty members for its new data-driven science cluster, adding to its expertise.

This fits very nicely with Kelly’s analytics internship at the JHU-APL.  The other thing I thought was fun and interesting is the connection was not just to the Statistics department, but to the Applied Mathematics department, too.  Christian is an Applied Math major.  The article also talks about the Professional Masters Degree in Analytics our friend Andrew earned last year.

Read more here: http://www.newsobserver.com/2013/08/15/3109412/nc-state-teams-up-with-nsa-on.html#storylink=cpy

What does a Statistician do?

Day 651 of 1000

When Kelly tells people she is a Statistics major, people often ask if it is possible to get a job with that degree.  Beside the tactlessness of the question we are amazed that people know so little about what is driving innovation in medicine, the internet, marketing, agriculture, sociology, psychology, and just about every other field imaginable.  Big money is invested to mine information from the mountains of data produced in clinical studies, internet commerce, engineering research, etc.  A deep knowledge of statistics is required to do this work.  Statisticians are in big demand.

What prompted this diatribe?  I have written about some of the demand for statistical knowledge in the past (see here and here), but another example showed up today in an article on ZDNet today.  Dell and Intel are building a “Big Data” innovation center in Singapore.  Who will man the center?  Statisticians!

Kelly’s toughest statistics class – done

Day 624 of 1000

Kelly's study notes for Mathematical Statistics II, her toughest class
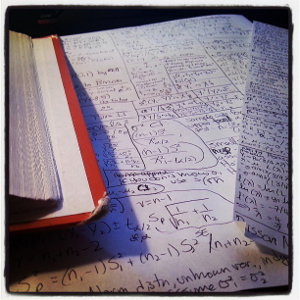
There are plenty of hard classes in Kelly’s Statistics program at NCSU, but everyone believes Mathematical Statistics II is probably the hardest.  Kelly has been hammering away at this class since the beginning of the year and did her final in the course on Tuesday.  She feels great about her understanding of the material, but tests are tests so she is sitting on pins and needles while she waits for the results.  She put the following image of her study notes up on Facebook.  I had to write about them here.  Someone on Facebook actually said this was frameable artwork.  I agree!  I think this might be a great thing to have on the wall in my office.
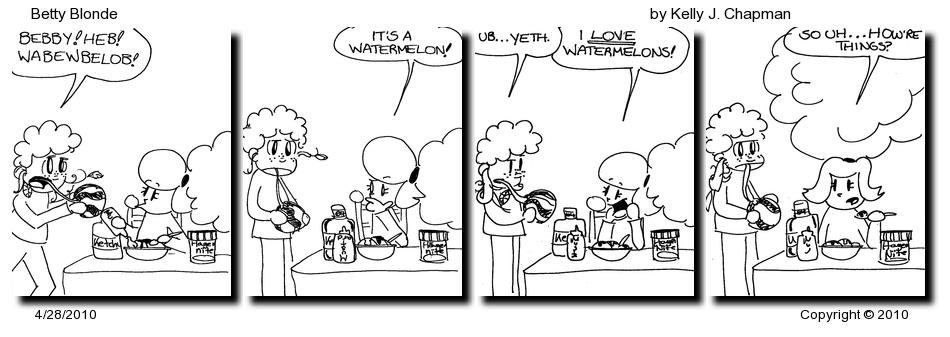
Humanities and Social Science degrees should require more math

Day 615 of 1000

Kelly’s enthusiasm for all things statistical and a discussion with her yesterday inspired me to look back through a few articles from The Numbers Guy at the Wall Street Journal.  I found a great article that describes why I think the higher education system in America generally fails many Humanities and Social Science students.  Most of them do not have the skills to properly evaluate many conclusions based on statistics and mathematics.  Of course, there are significant exceptions.  Rodney Stark, about whom I have written in the past, is also a numbers guy1.  Stark’s research and conclusions are driven by numbers.  His research does not lead to a priori conclusions based on the current Zeitgiest.  Rather, he lets number tell their own story, records the results, and makes conclusions based on those results.  It does not hurt that he writes about really interesting stuff and has an accessible and engaging writing style.

I recommend you read the whole article, but here is a quote that describes the problem:

In the latest study, Kimmo Eriksson, a mathematician and researcher of social psychology at Sweden’s Mälardalen University, chose two abstracts from papers published in research journals, one in evolutionary anthropology and one in sociology. He gave them to 200 people to rate for quality—with one twist. At random, one of the two abstracts received an additional sentence, the one above with the math equation, which he pulled from an unrelated paper in psychology. The study’s 200 participants all had master’s or doctoral degrees. Those with degrees in math, science or technology rated the abstract with the tacked-on sentence as slightly lower-quality than the other. But participants with degrees in humanities, social science or other fields preferred the one with the bogus math, with some rating it much more highly on a scale of 0 to 100.

One of the features of a “Liberal education” classically defined is that it values a wide breadth of knowledge.  Early on, that meant that mathematicians and physicists were required to have as deep a knowledge of literature and history as possible while historians and literature students were required to have as deep a knowledge of mathematics and physics as possible.  It seems like this is not valued as much as it was in the pass both the hard and soft sciences have suffered for it.  If a Humanities graduate or Social Scientist believes a paper is better solely because it has a cryptic looking equation in it, even if the equation is bogus, that idea certainly seems to be vindicated.

1.  Full disclosure:  I read every Rodney Stark book I can get my hands on and am pretty much a Rodney Stark fanboy.

Page 1 of 2

Powered by WordPress & Theme by Anders Norén