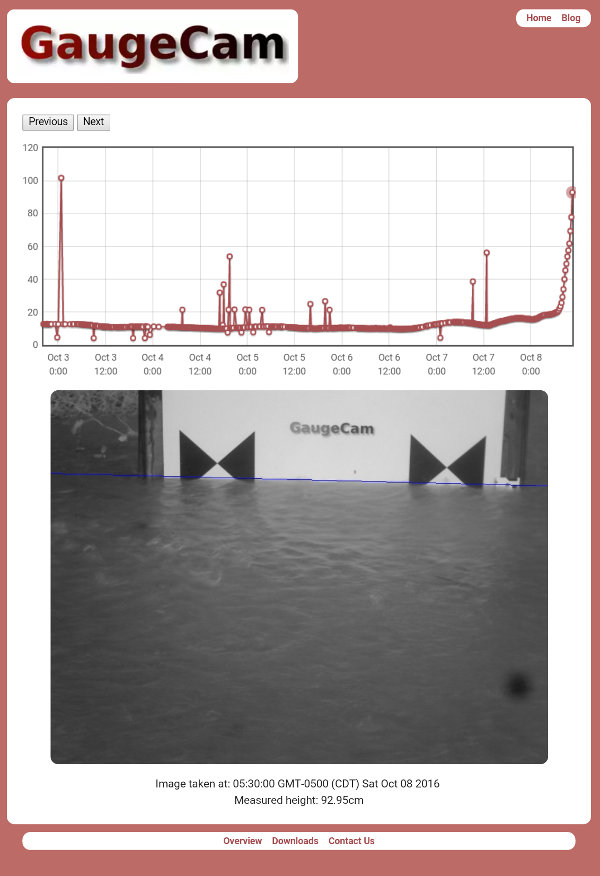
The following image speaks for itself. It shows the graph of water level from GaugeCam‘s camera viewing water level in a body of water near Goldsboro, NC at 6:30 AM yesterday morning in the face of flooding caused by Hurricane Matthew. There is an image that appears as you hover the mouse cursor (arrow) over the dots on the graph. It is an amazing visualization of the flood from which we are working on a video. The spikes in the middle of the curve are anomalies. On the far right side of the graph you can see the water rise dramatically.
Leave a Reply